
Possibilities with Dynamo for Revit
This article shows examples of how Dynamo for Revit can automate BIM workflows, making them more efficient and time-saving. I will present three use cases that highlight how Dynamo simplifies tasks especially working with a lot of data.
Dynamo is an open-source visual programming tool primarily used for Revit but is also available for Civil 3D. Functioning as an add-in for Revit, it enables users to automate complex tasks, perform parametric modeling, and optimize workflows without requiring extensive programming knowledge. This makes it particularly useful for those who are not deeply familiar with traditional programming languages but still seek to streamline processes. Additionally, a sandbox version is available, allowing Dynamo to be used independently of Revit.
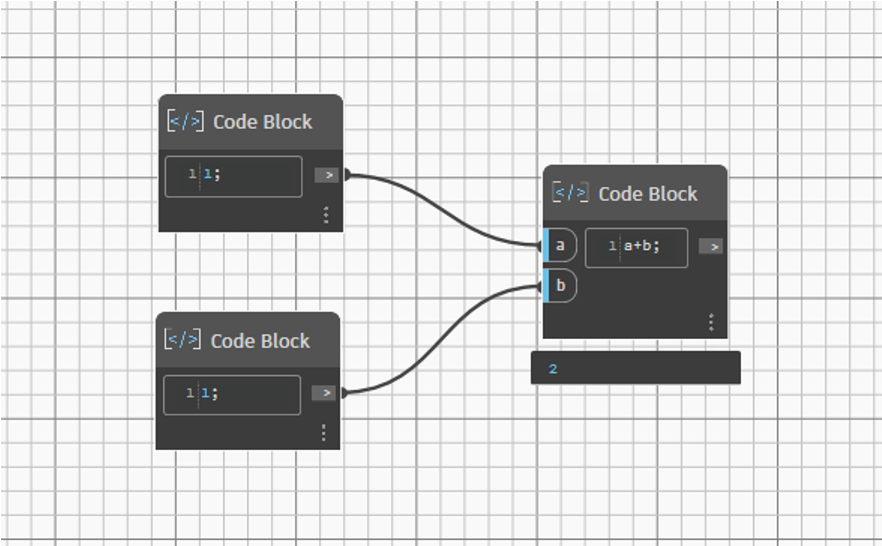
To understand visual programming, imagine replacing traditional code with nodes that represent functions. Users connect these nodes with lines to define how data flows between them. For example, a simple addition can be represented by linking two values (e.g., 1 and 1) to a “+” node, which then outputs 2 (see Fig. 1).
One of Dynamo’s biggest advantages is its ability to manipulate Revit objects directly, making it invaluable for handling large-scale projects or working with complex geometries that can be described using mathematical equations or even managing semantic data. In addition to the built-in function library, users can extend its capabilities by incorporating third-party packages. If the out of the box solutions and packages aren’t enough, you also have the option to integrate Python scripts for developing customized solutions for specific project requirements.
In the following I will show three use cases where Dynamo automates BIM workflows: Generation of synthetic data, Construction Progress Monitoring and Sustainability Assessment.
Generation of synthetic data for bridge segmentation
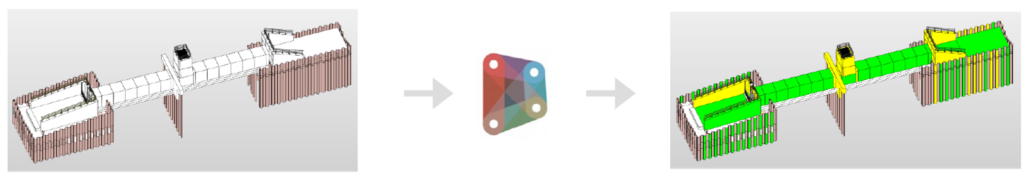
In this project the goal was to have a lot of data to train an artificial intelligence (AI). The conventional approach requires first scanning multiple bridges and then manually processing the point cloud data, cutting out elements, and saving them separately. Training an AI model requires a large amount of labeled data, making it a challenge to acquire and process enough real-world samples efficiently. Especially segmenting these components manually is an extremely time-consuming task. To overcome these challenges, synthetic bridge data was generated, where bridges were already pre-segmented. The segmentation process involves recognizing structural elements such as pillars, superstructure, abutments or handrails.
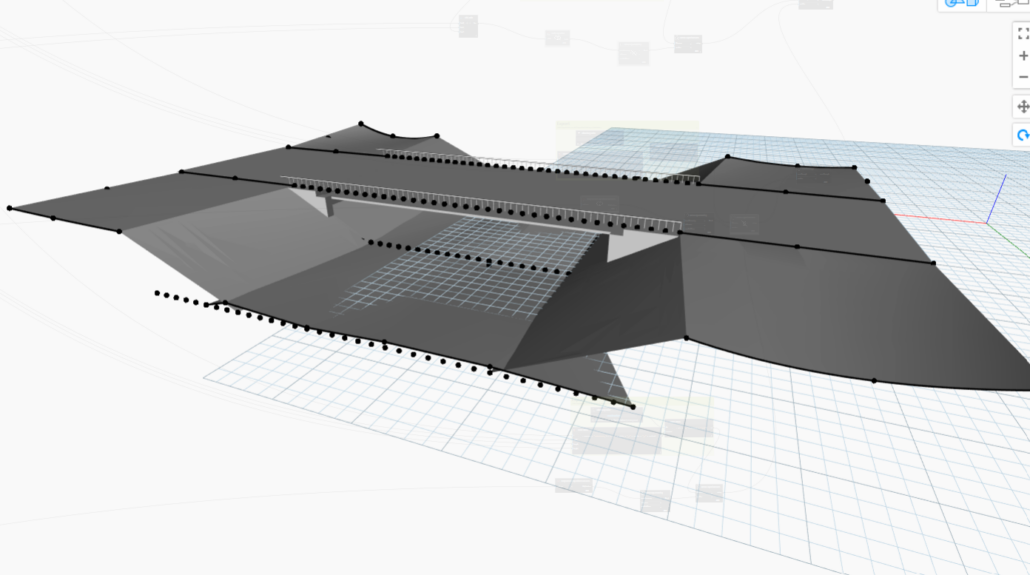
The data generation process was implemented using Dynamo, enabling the procedural creation of multiple bridges by defining parameters and randomly assigning values for height, length, and width. To achieve this, predefined bridge families were placed in Revit and extracted using Dynamo, establishing relationships between the individual components. This ensured that when a random width was assigned, all bridge elements adapted accordingly to maintain geometric consistency.
In addition to the bridge structure itself, surrounding context elements were randomly generated to create a more realistic dataset (see Fig. 2). The resulting bridge models were then exported as object files and converted into point clouds. While points could be sampled and exported, initial random sampling did not fully replicate the patterns of real laser scanners, so this aspect was not implemented in Dynamo.
With these synthetically generated, pre-segmented point clouds, an AI model was trained for automated bridge segmentation. Further details on the AI methodology can be found in the following publication: http://dx.doi.org/10.1016/j.autcon.2025.106021.
Construction Progress Monitoring
This project was the focus of my Bachelor’s thesis, which I completed at the Geodetic Institute of RWTH Aachen University. During this time, I began exploring Dynamo and developed the TABAKO-script. There is no relation to tabacco but actually is an acronym for the german terms”TeilAutomatisierte BAufortschrittsKOntrolle”.
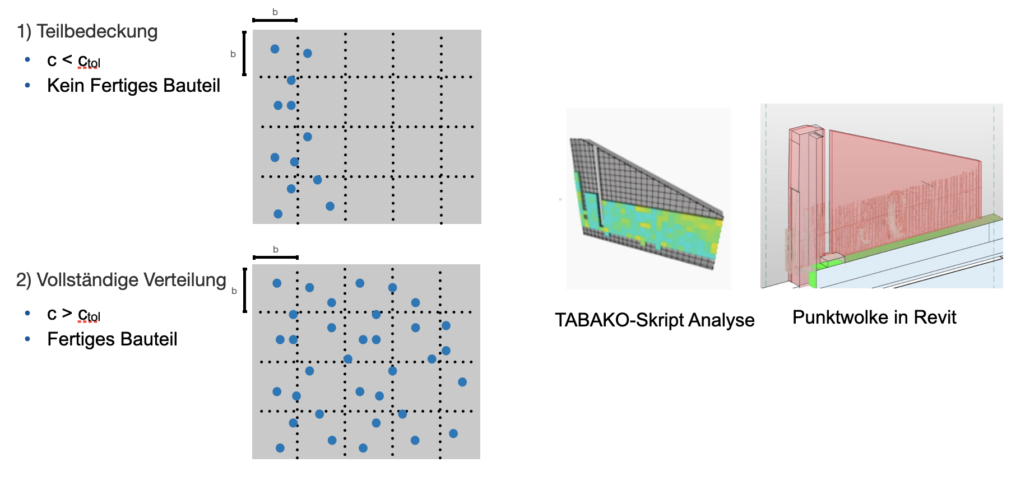
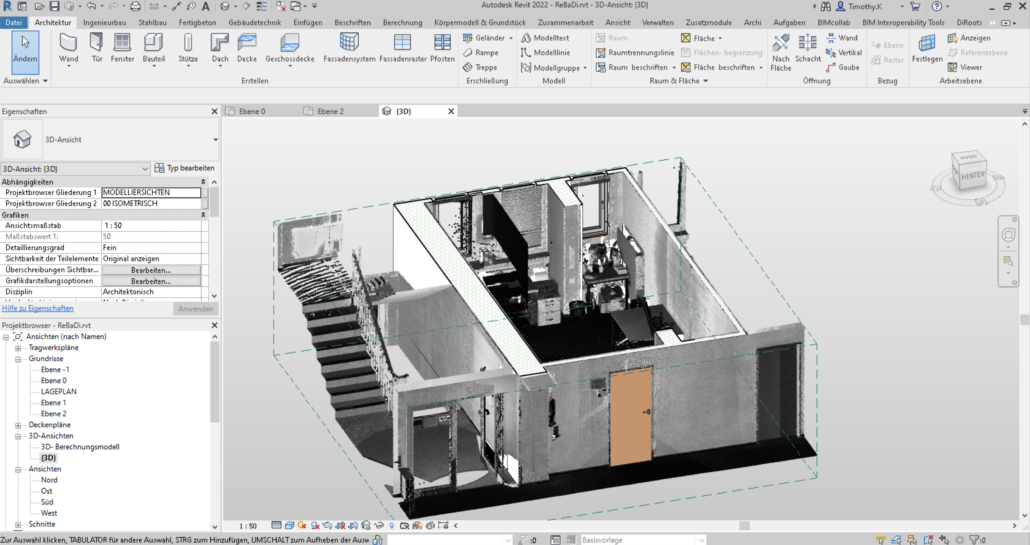
The script overlays point clouds with the as-planned model and performs geometric checks to determine if the points in the cloud align with the elements in the as-planned model. Based on this alignment, analyses are conducted to interpret the data, and multiple verifications are performed to ensure that the elements are indeed constructed and not obstructed by random objects. Through a bounding box all BIM element specific points are filtered (see Fig. 5).

Additionally, a grid verification is used to assess the distribution of points across the entire surface (see Fig. 6). For example, if the coverage is only 20%, it could indicate that the wall has not yet been built. On the other hand, a coverage of 90% could suggest that the wall is fully constructed.
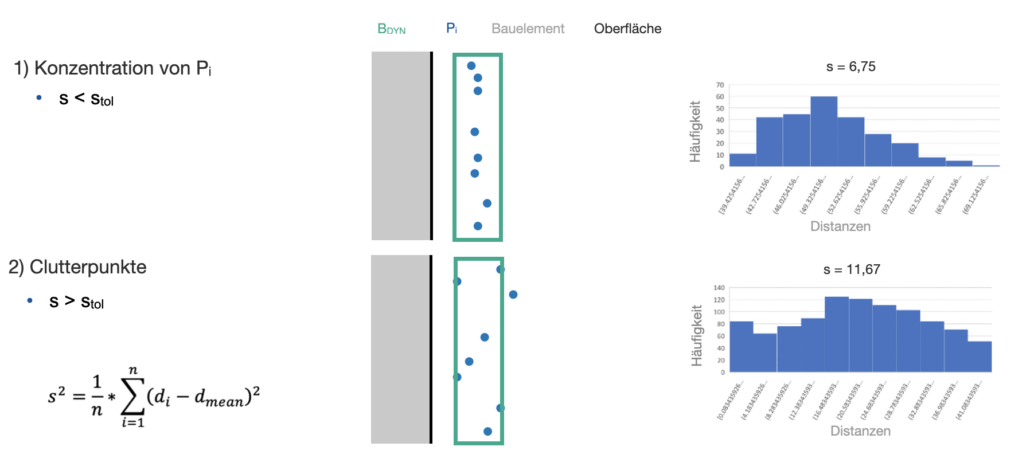
The standard deviation is calculated to determine if the surface is truly planar; a smaller deviation indicates a higher likelihood of a flat surface, as opposed to irregular features like rebars.
Sustainability Assessment
In this project I developed a script to automatically calculate the most cost-efficient solution for the maintenance of concrete steel walls to support data-driven decision-making. Maintenance of reinforced concrete structures has to consider cost-efficiency with environmental sustainability.
First, an as built-model has to be modelled based on a lasers scan. Additionally the rebars have been scanned and implemented in the as-built model. Then for a sustainability assessment, an algorithm was developed using Dynamo.

This algorithm connects the BIM model with an external database, allowing ecological and economic parameters to be stored directly within the model. It evaluates maintenance operations based on two key scenarios: environmental sustainability, measured by CO₂ emissions, and economic sustainability, assessed by cost factors. The Dynamo script processes these scenarios by extracting relevant data from the database, enabling an informed comparison of cost-effective and environmentally friendly maintenance strategies.
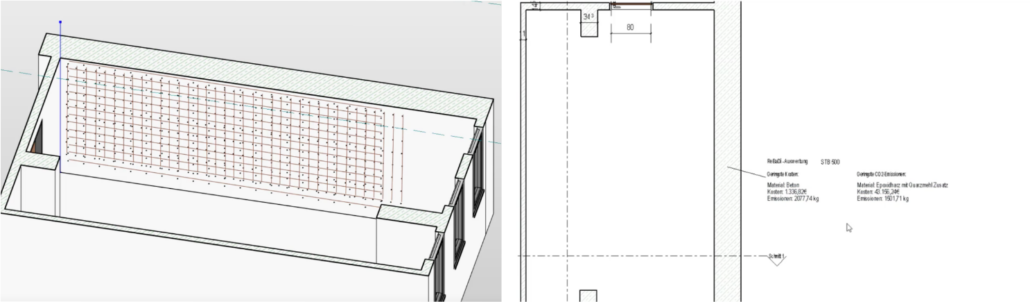
Here is a video demonstrating how the external data and evaluation within Dynamo can be visualized within Revit. By enriching BIM models with sustainability data, this method enables a more informed decision-making in infrastructure maintenance.
For further reference see this publication: http://dx.doi.org/10.1201/9781003323020-455
In conclusion, Dynamo for Revit offers a powerful platform to automate and enhance BIM workflows. Dynamo streamlines BIM workflows by automating repetitive tasks and reducing errors. The examples show its potential to improve efficiency and precision in design and construction. As automation becomes standard in the AEC industry, tools like Dynamo will be essential for staying competitive.
